Tutorial 2 - Atherosclerosis (Xenium + CODEX)
[1]:
import os
import torch
import scanpy as sc
import importlib
import numpy as np
[ ]:
from COSIE.data_preprocessing import load_data
from COSIE.utils import setup_seed
from COSIE.configure import get_default_config
from COSIE.COSIE_framework import COSIE_model
from COSIE.downstream_analysis import *

config = get_default_config()
setup_seed(config['training']['seed'])
Load data
section1: HE + Xenium_panel1
section2: HE + Xenium_panel2
section3: HE + CODEX
[3]:
file_path = '../../../project/SpatialMultimodal/datasets/Atherosclerosis'
[4]:
adata_panel1 = sc.read_h5ad(os.path.join(file_path,'adata_Xenium_panel1.h5ad'))
adata_panel2 = sc.read_h5ad(os.path.join(file_path,'adata_Xenium_panel2.h5ad'))
adata_codex = sc.read_h5ad(os.path.join(file_path,'adata_CODEX.h5ad'))
adata_panel1, adata_panel2, adata_codex
[4]:
(AnnData object with n_obs × n_vars = 432290 × 314
     obsm: 'UNI_feature', 'spatial', 'transformed_pxl_loc_in_morphology',
 AnnData object with n_obs × n_vars = 412152 × 345
     obsm: 'UNI_feature', 'spatial', 'transformed_pxl_loc_in_morphology',
 AnnData object with n_obs × n_vars = 430530 × 43
     obsm: 'UNI_feature', 'spatial', 'transformed_pxl_loc_in_dapi')
[5]:
adata_panel1.var_names_make_unique()
adata_panel2.var_names_make_unique()
adata_codex.var_names_make_unique()
[6]:
adata1_he = sc.AnnData(X=adata_panel1.obsm['UNI_feature'])
adata1_he.obsm['spatial'] = adata_panel1.obsm['spatial'].copy()
adata2_he = sc.AnnData(X=adata_panel2.obsm['UNI_feature'])
adata2_he.obsm['spatial'] = adata_panel2.obsm['spatial'].copy()

adata1_he, adata2_he
[6]:
(AnnData object with n_obs × n_vars = 432290 × 2048
     obsm: 'spatial',
 AnnData object with n_obs × n_vars = 412152 × 2048
     obsm: 'spatial')
[7]:
adata3_he = sc.AnnData(X=adata_codex.obsm['UNI_feature'])
adata3_he.obsm['spatial'] = adata_codex.obsm['spatial'].copy()
adata3_he
[7]:
AnnData object with n_obs × n_vars = 430530 × 2048
    obsm: 'spatial'
Define the dictionary structure for input data
Each column denotes one section and None represents that the modality is missing in that section.
[8]:
data_dict = {
        'HE': [adata1_he, adata2_he, adata3_he],
        'RNA': [adata_panel1, None, None],
        'RNA_panel2': [None, adata_panel2, None],
        'Protein': [None, None, adata_codex]
    }
Specify the linkage indicator
COSIE requires a indicator dictionary to specify the cross-section linkage used during training. COSIE utilized all the available strong and weak linkages during integration.
[9]:
Linkage_indicator = {
        ('s1', 's2'): [('HE', 'HE'), ('RNA', 'RNA_panel2')],
        ('s1', 's3'): [('HE','HE'),('RNA', 'Protein')],
        ('s2', 's3'): [('HE','HE'),('RNA_panel2', 'Protein')],
    }
[10]:
feature_dict, spatial_loc_dict, data_dict_processed = load_data(data_dict, hvg_num=None, n_comps=50, metacell = True)
Combine adjacent 4 cells into metacell to save memory and speed up computation
-------- Processing shared modality HE across sections --------
Running Harmony for HE
2025-05-17 20:32:56,821 - harmonypy - INFO - Computing initial centroids with sklearn.KMeans...
2025-05-17 20:33:13,212 - harmonypy - INFO - sklearn.KMeans initialization complete.
2025-05-17 20:33:15,253 - harmonypy - INFO - Iteration 1 of 10
2025-05-17 20:34:54,525 - harmonypy - INFO - Iteration 2 of 10
2025-05-17 20:36:41,663 - harmonypy - INFO - Converged after 2 iterations
-------- Processing unique modality RNA for section 1 --------
-------- Processing unique modality RNA_panel2 for section 2 --------
-------- Processing unique modality Protein for section 3 --------
Extracting spatial location for section 1
Extracting spatial location for section 2
Extracting spatial location for section 3
[ ]:
Define COSIE Model and Perform Integration
After training, embeddings will be saved to file_path in .npy format.
[12]:
model = COSIE_model(config, feature_dict)
optimizer = torch.optim.Adam(model.parameters(), lr=config['training']['lr'])
device = torch.device('cuda:0' if torch.cuda.is_available() else 'cpu')
print(f'Using device: {device}')
All modalities: ['HE', 'RNA', 'RNA_panel2', 'Protein']
-------- Encoder description --------
Encoder [HE]: Input 50 → Hidden [256, 128]
Encoder [RNA]: Input 50 → Hidden [256, 128]
Encoder [RNA_panel2]: Input 50 → Hidden [256, 128]
Encoder [Protein]: Input 20 → Hidden [256, 128]
-------- Dual prediction module description --------
Predictor [HE → RNA]: [128, 512, 512, 128]
Predictor [RNA → HE]: [128, 512, 512, 128]
Predictor [HE → RNA_panel2]: [128, 512, 512, 128]
Predictor [RNA_panel2 → HE]: [128, 512, 512, 128]
Predictor [HE → Protein]: [128, 512, 512, 128]
Predictor [Protein → HE]: [128, 512, 512, 128]
Using device: cuda:0
[13]:
final_embeddings = model.train_model(file_path, config, optimizer, device, feature_dict, spatial_loc_dict,
                                     data_dict_processed, Linkage_indicator, n_x=1, n_y=2)
-------- Running Sub-graph training mode, n_x is 1, n_y is 2 --------
Splitting section [s1] into 1 x 2 subgraphs
Splitting HE in section s1...
Splitting RNA in section s1...
Splitting section [s2] into 1 x 2 subgraphs
Splitting HE in section s2...
Splitting RNA_panel2 in section s2...
Splitting section [s3] into 1 x 2 subgraphs
Splitting HE in section s3...
Splitting Protein in section s3...
Computing linkage between [HE] (s1-0) and [HE] (s2-0)
Computing linkage between [RNA] (s1-0) and [RNA_panel2] (s2-0)
Number of overlapping features: 111
Computing linkage between [HE] (s1-0) and [HE] (s2-1)
Computing linkage between [RNA] (s1-0) and [RNA_panel2] (s2-1)
Number of overlapping features: 111
Computing linkage between [HE] (s1-1) and [HE] (s2-0)
Computing linkage between [RNA] (s1-1) and [RNA_panel2] (s2-0)
Number of overlapping features: 111
Computing linkage between [HE] (s1-1) and [HE] (s2-1)
Computing linkage between [RNA] (s1-1) and [RNA_panel2] (s2-1)
Number of overlapping features: 111
Computing linkage between [HE] (s1-0) and [HE] (s3-0)
Computing linkage between [RNA] (s1-0) and [Protein] (s3-0)
Number of overlapping features: 14
Computing linkage between [HE] (s1-0) and [HE] (s3-1)
Computing linkage between [RNA] (s1-0) and [Protein] (s3-1)
Number of overlapping features: 14
Computing linkage between [HE] (s1-1) and [HE] (s3-0)
Computing linkage between [RNA] (s1-1) and [Protein] (s3-0)
Number of overlapping features: 14
Computing linkage between [HE] (s1-1) and [HE] (s3-1)
Computing linkage between [RNA] (s1-1) and [Protein] (s3-1)
Number of overlapping features: 14
Computing linkage between [HE] (s2-0) and [HE] (s3-0)
Computing linkage between [RNA_panel2] (s2-0) and [Protein] (s3-0)
Number of overlapping features: 8
Computing linkage between [HE] (s2-0) and [HE] (s3-1)
Computing linkage between [RNA_panel2] (s2-0) and [Protein] (s3-1)
Number of overlapping features: 8
Computing linkage between [HE] (s2-1) and [HE] (s3-0)
Computing linkage between [RNA_panel2] (s2-1) and [Protein] (s3-0)
Number of overlapping features: 8
Computing linkage between [HE] (s2-1) and [HE] (s3-1)
Computing linkage between [RNA_panel2] (s2-1) and [Protein] (s3-1)
Number of overlapping features: 8
Model moved to cuda:0!
---------------- Constructing Full Graph ----------------
-------- Constructing full spatial graph for s1 --------
 Constructing full feature graph for [s1 - HE]...
 Constructing full feature graph for [s1 - RNA]...
-------- Constructing full spatial graph for s2 --------
 Constructing full feature graph for [s2 - HE]...
 Constructing full feature graph for [s2 - RNA_panel2]...
-------- Constructing full spatial graph for s3 --------
 Constructing full feature graph for [s3 - HE]...
 Constructing full feature graph for [s3 - Protein]...
---------------- Graph Construction in Subgraph Level ----------------
-------- Constructing spatial graphs for s1 - Subgraph 0 --------
-------- Constructing feature graph for [s1 - Subgraph 0 - HE] --------
-------- Constructing feature graph for [s1 - Subgraph 0 - RNA] --------
-------- Constructing spatial graphs for s1 - Subgraph 1 --------
-------- Constructing feature graph for [s1 - Subgraph 1 - HE] --------
-------- Constructing feature graph for [s1 - Subgraph 1 - RNA] --------
-------- Constructing spatial graphs for s2 - Subgraph 0 --------
-------- Constructing feature graph for [s2 - Subgraph 0 - HE] --------
-------- Constructing feature graph for [s2 - Subgraph 0 - RNA_panel2] --------
-------- Constructing spatial graphs for s2 - Subgraph 1 --------
-------- Constructing feature graph for [s2 - Subgraph 1 - HE] --------
-------- Constructing feature graph for [s2 - Subgraph 1 - RNA_panel2] --------
-------- Constructing spatial graphs for s3 - Subgraph 0 --------
-------- Constructing feature graph for [s3 - Subgraph 0 - HE] --------
-------- Constructing feature graph for [s3 - Subgraph 0 - Protein] --------
-------- Constructing spatial graphs for s3 - Subgraph 1 --------
-------- Constructing feature graph for [s3 - Subgraph 1 - HE] --------
-------- Constructing feature graph for [s3 - Subgraph 1 - Protein] --------
Training started!
Training Epochs: 100%|████████████████████████████████████████████████████████████████| 600/600 [12:10<00:00, 1.22s/it]
 Running Evaluation...
Missing modality [RNA_panel2] in Section [s1]
Using predictor [HE → RNA_panel2] to recover missing embedding...
Missing modality [Protein] in Section [s1]
Using predictor [HE → Protein] to recover missing embedding...
Mapping metacell embedding back to original cells for Section s1 using modality [HE]
Missing modality [RNA] in Section [s2]
Using predictor [HE → RNA] to recover missing embedding...
Missing modality [Protein] in Section [s2]
Using predictor [HE → Protein] to recover missing embedding...
Mapping metacell embedding back to original cells for Section s2 using modality [HE]
Missing modality [RNA] in Section [s3]
Using predictor [HE → RNA] to recover missing embedding...
Missing modality [RNA_panel2] in Section [s3]
Using predictor [HE → RNA_panel2] to recover missing embedding...
Mapping metacell embedding back to original cells for Section s3 using modality [HE]
All embeddings have been saved to ../../../project/SpatialMultimodal/datasets/Atherosclerosis
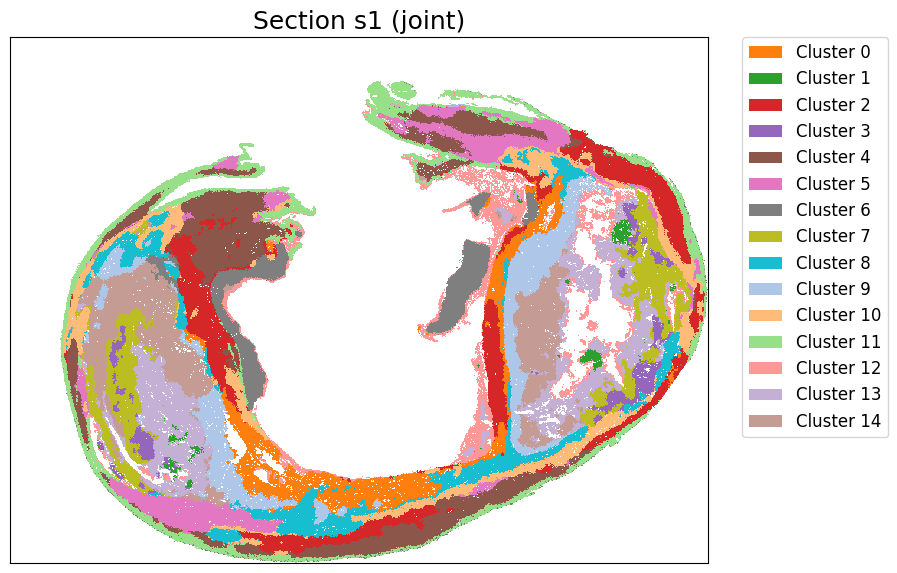
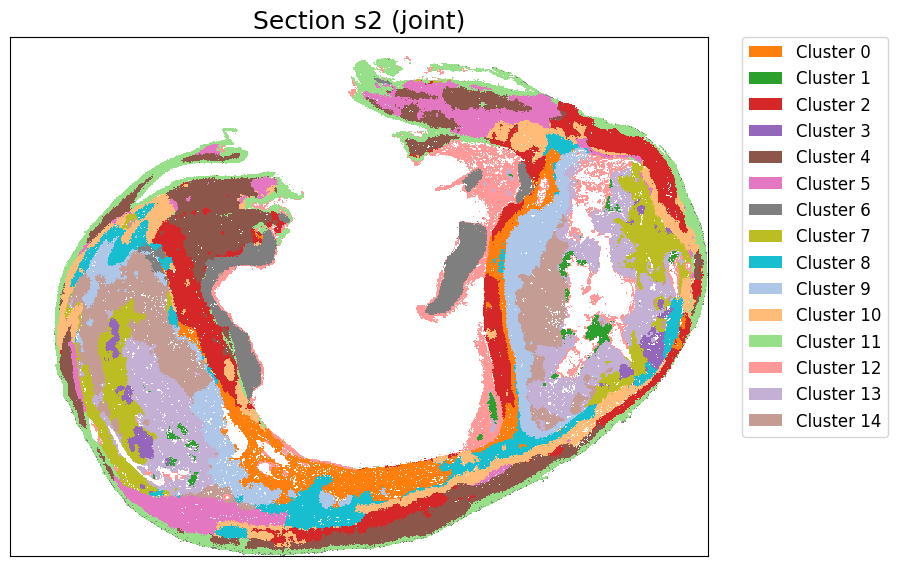
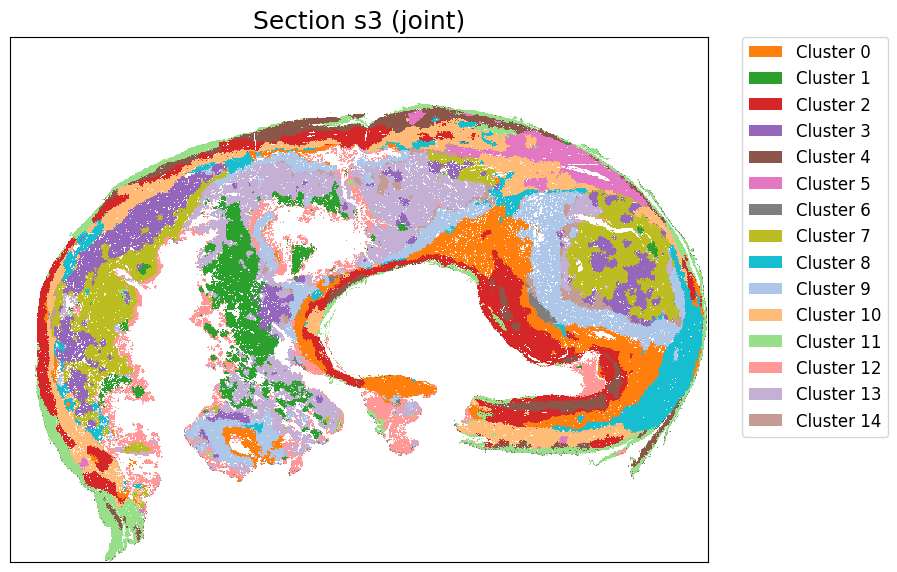
Perform clustering and visualization
[19]:
cluster_label = cluster_and_visualize_superpixel(final_embeddings,
                                                 data_dict,
                                                 n_clusters=15,
                                                 mode="joint",
                                                 vis_basis="spatial",
                                                 figscale = 120)
Perform joint clustering...
[ ]:
Perform prediction
For prediction convenience, separate panel1-specific genes, panel2-specific genes and common genes
[20]:
common_genes = adata_panel1.var_names.intersection(adata_panel2.var_names)
len(common_genes)
[20]:
111
[21]:
adata_panel1_com = adata_panel1[:, common_genes].copy()
adata_panel2_com = adata_panel2[:, common_genes].copy()
adata_panel1_com.obs_names = adata_panel1_com.obs_names + "_p1"
adata_panel2_com.obs_names = adata_panel2_com.obs_names + "_p2"
adata_panel1_com, adata_panel2_com
[21]:
(AnnData object with n_obs × n_vars = 432290 × 111
     obsm: 'UNI_feature', 'spatial', 'transformed_pxl_loc_in_morphology',
 AnnData object with n_obs × n_vars = 412152 × 111
     obsm: 'UNI_feature', 'spatial', 'transformed_pxl_loc_in_morphology')
[22]:
p1_spec_genes = adata_panel1.var_names.difference(common_genes)
p2_spec_genes = adata_panel2.var_names.difference(common_genes)

len(p1_spec_genes), len(p2_spec_genes)
[22]:
(203, 234)
[23]:
adata_panel1_spec = adata_panel1[:, p1_spec_genes].copy()
adata_panel2_spec = adata_panel2[:, p2_spec_genes].copy()
adata_panel1_spec, adata_panel2_spec
[23]:
(AnnData object with n_obs × n_vars = 432290 × 203
     obsm: 'UNI_feature', 'spatial', 'transformed_pxl_loc_in_morphology',
 AnnData object with n_obs × n_vars = 412152 × 234
     obsm: 'UNI_feature', 'spatial', 'transformed_pxl_loc_in_morphology')
[24]:
data_dict_new = {
        'HE': [adata1_he, adata2_he, adata3_he],
        'RNA_p1_spec': [adata_panel1_spec, None, None],
        'RNA_p2_spec': [None, adata_panel2_spec, None],
        'RNA_com': [adata_panel1_com, adata_panel2_com, None],
        'Protein': [None, None, adata_codex]
    }
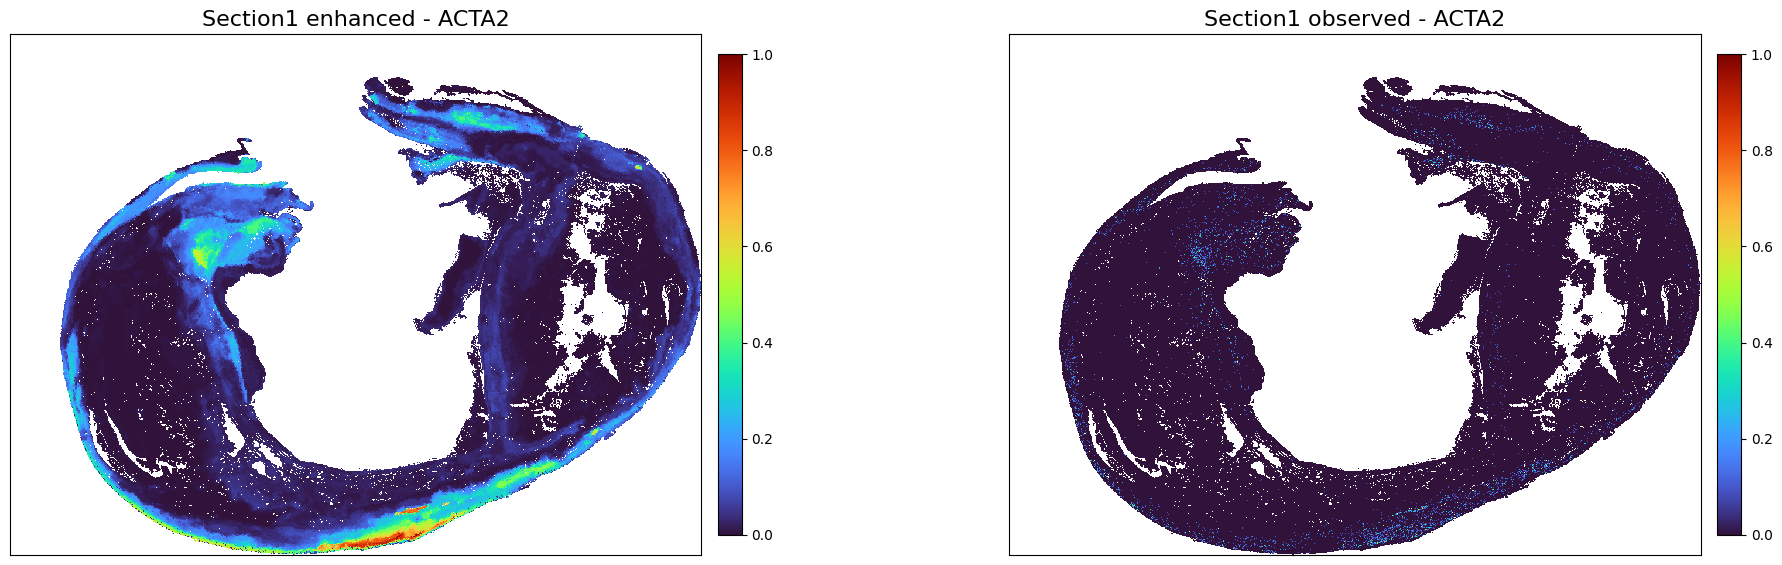
1. Prediction of Section1
1-1 Common genes enhancement
[25]:
adata1_com_predicted = perform_prediction(data_dict_new,
    final_embeddings,
    target_section = 's1',
    target_modality = 'RNA_com',
    source_sections=['s2'],
    K_num=500,
    target_molecules='All',
    )
Using modality [HE] in section [s1] as spatial/obs reference
Manually specify ['s2'] as source data
[26]:
adata1_com_predicted
[26]:
AnnData object with n_obs × n_vars = 432290 × 111
    obsm: 'spatial'
[27]:
adata_panel1_norm = create_normalized_adata(adata_panel1)
adata_panel2_norm = create_normalized_adata(adata_panel2)
[29]:
adata1_com_predicted_norm = create_normalized_adata(adata1_com_predicted)
plot_marker_comparison_superpixel('ACTA2',
                       adata1_com_predicted_norm,
                       adata_panel1_norm,
                       'Section1 enhanced',
                       'Section1 observed',
                        colormap = 'turbo',
                        figscale = 100,)
[ ]:
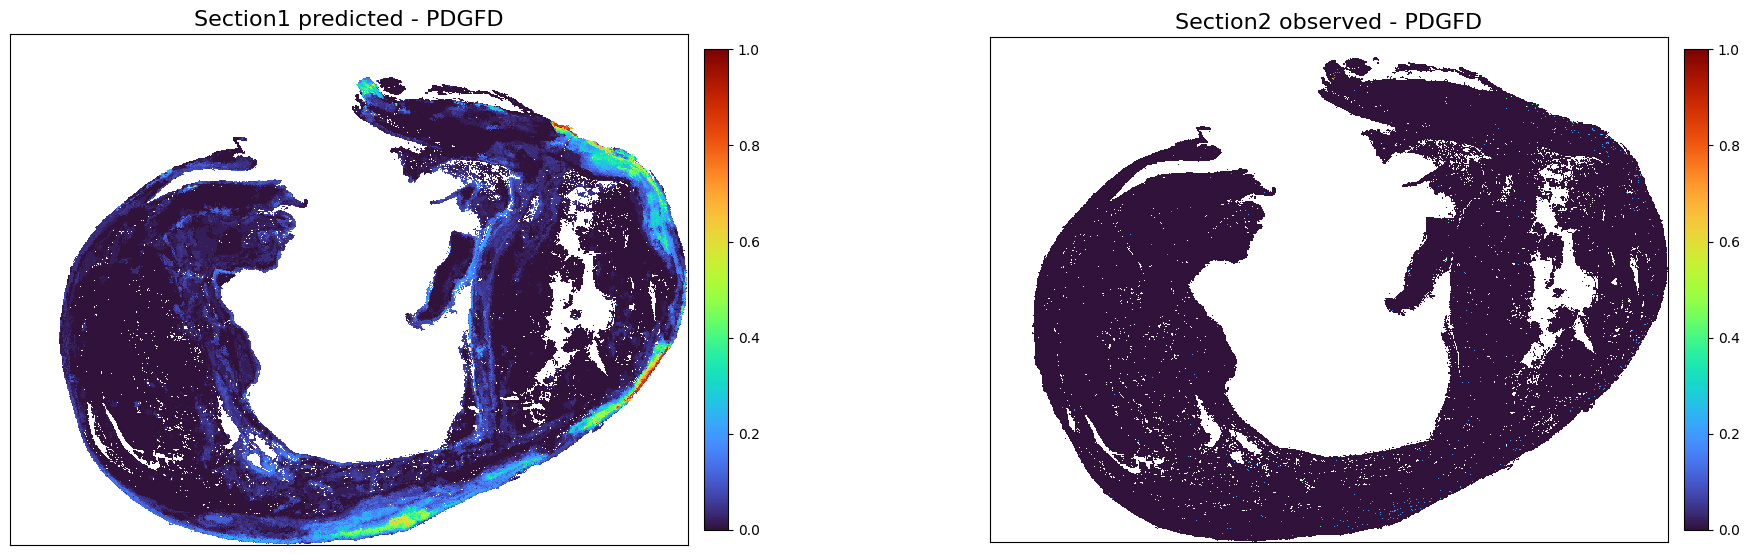
1-2 Panel2-specific genes prediction
[30]:
adata1_p2_spec_predicted = perform_prediction(data_dict_new,
    final_embeddings,
    target_section = 's1',
    target_modality = 'RNA_p2_spec',
    source_sections=['s2'],
    K_num=500,
    target_molecules='All',
    )
Using modality [HE] in section [s1] as spatial/obs reference
Manually specify ['s2'] as source data
[31]:
adata1_p2_spec_predicted_norm = create_normalized_adata(adata1_p2_spec_predicted)
plot_marker_comparison_superpixel('PDGFD',
                       adata1_p2_spec_predicted_norm,
                       adata_panel2_norm,
                       'Section1 predicted',
                       'Section2 observed',
                        colormap = 'turbo',
                        figscale = 100,)
[ ]:
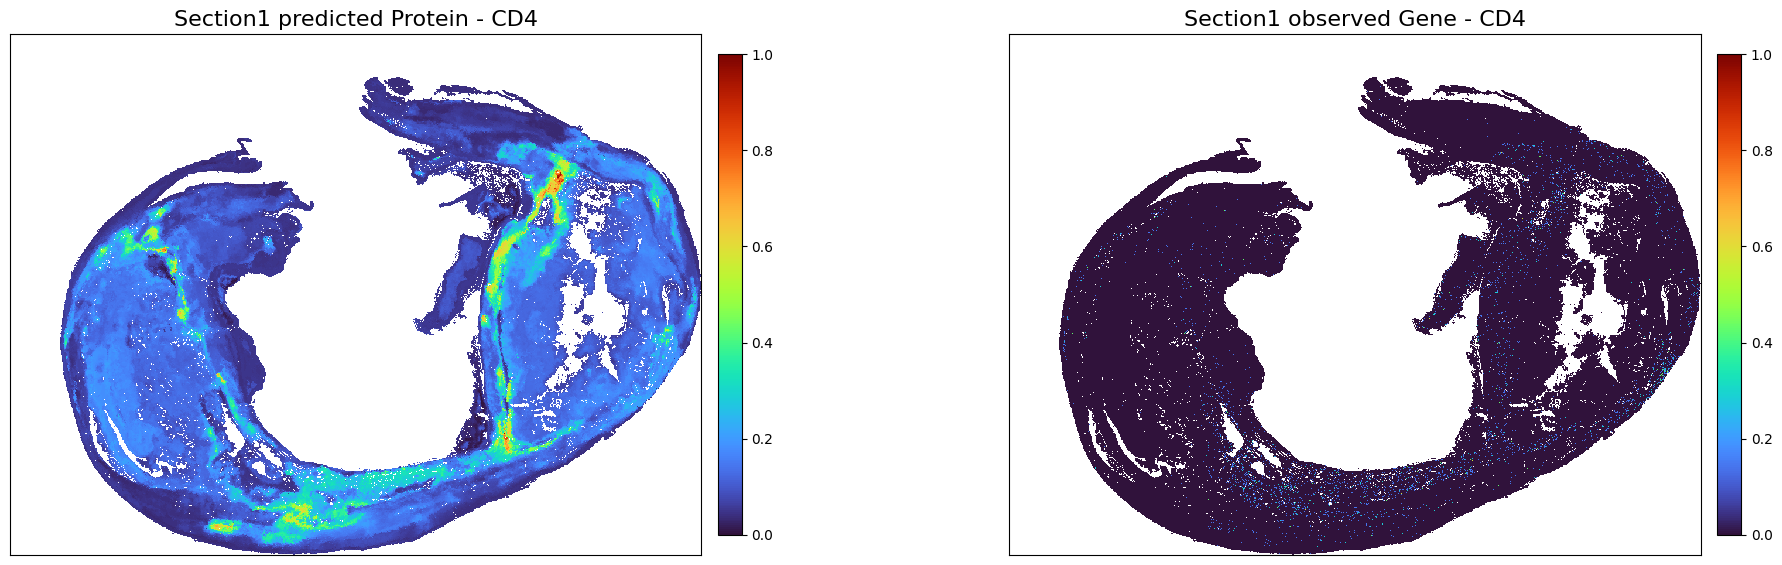
1-3 Protein prediction
[33]:
adata1_protein_predicted = perform_prediction(data_dict_new,
    final_embeddings,
    target_section = 's1',
    target_modality = 'Protein',
    K_num=500,
    target_molecules='All',
    )
Using modality [HE] in section [s1] as spatial/obs reference
[Protein] exists in ['s3'], which will be used as source data section
[34]:
adata1_protein_predicted_norm = create_normalized_adata(adata1_protein_predicted)
plot_marker_comparison_superpixel('CD4',
                       adata1_protein_predicted_norm,
                       adata_panel1_norm,
                       'Section1 predicted Protein',
                       'Section1 observed Gene',
                        colormap = 'turbo',
                        figscale = 100,)
[ ]:
Prediction of Section2
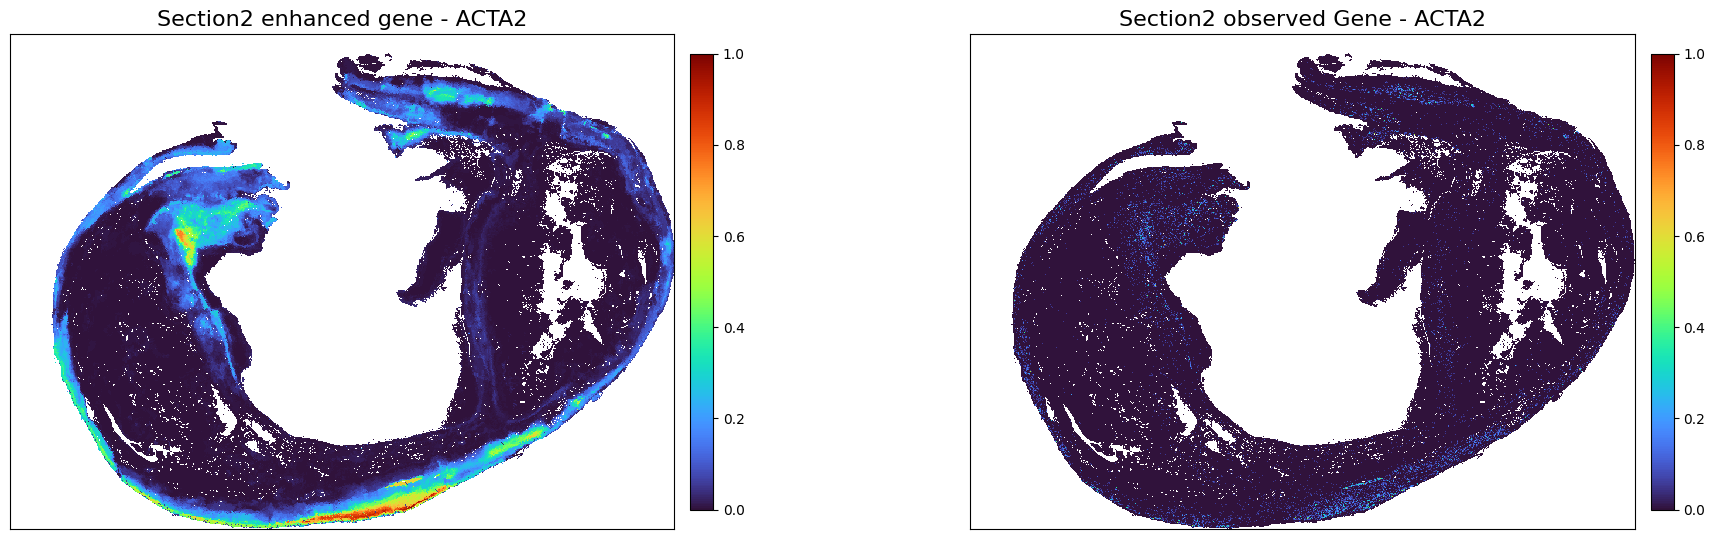
2-1 Common genes enhancement
[36]:
adata2_com_predicted = perform_prediction(data_dict_new,
    final_embeddings,
    target_section = 's2',
    target_modality = 'RNA_com',
    source_sections=['s1'],
    K_num=500,
    target_molecules='All',
    )
Using modality [HE] in section [s2] as spatial/obs reference
Manually specify ['s1'] as source data
[37]:
adata2_com_predicted
[37]:
AnnData object with n_obs × n_vars = 412152 × 111
    obsm: 'spatial'
[38]:
adata2_com_predicted_norm = create_normalized_adata(adata2_com_predicted)
plot_marker_comparison_superpixel('ACTA2',
                       adata2_com_predicted_norm,
                       adata_panel2_norm,
                       'Section2 enhanced gene',
                       'Section2 observed Gene',
                        colormap = 'turbo',
                        figscale = 100,)
[ ]:
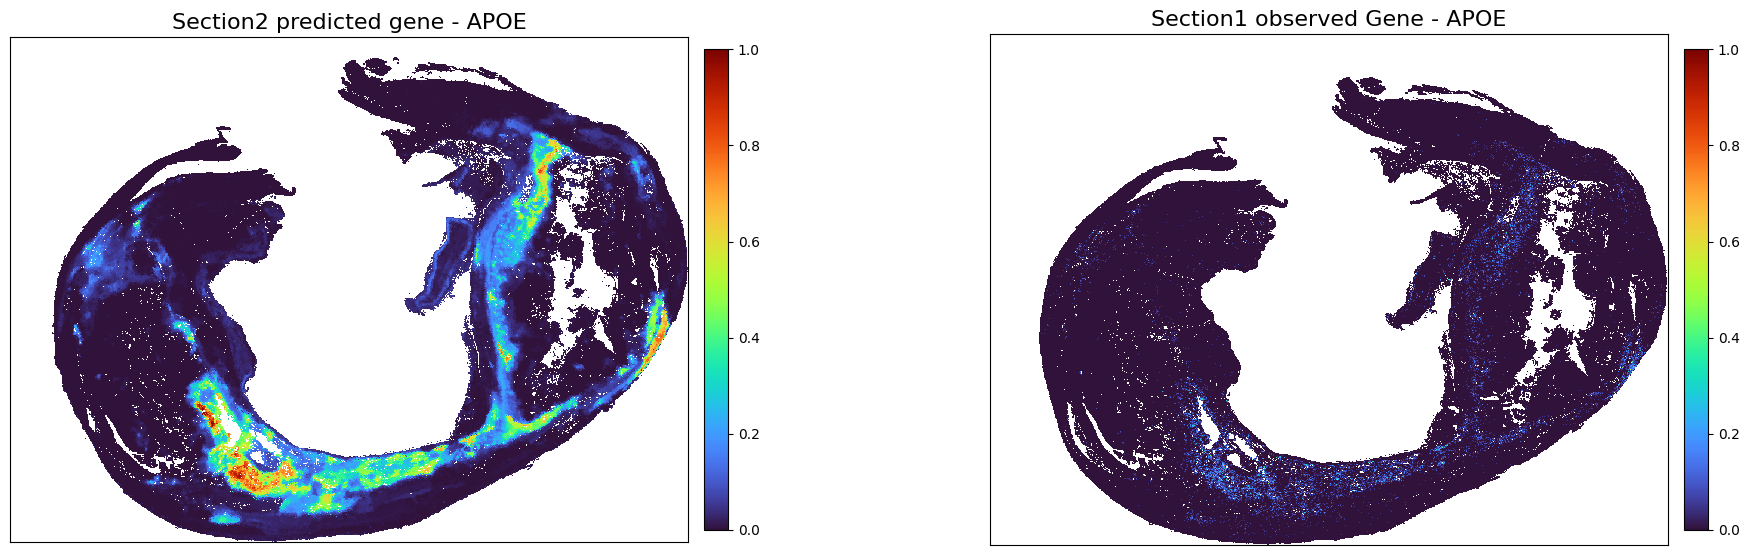
2-2 Panel1-specific genes prediction
[40]:
adata2_p1_spec_predicted = perform_prediction(data_dict_new,
    final_embeddings,
    target_section = 's2',
    target_modality = 'RNA_p1_spec',
    source_sections=['s1'],
    K_num=500,
    target_molecules='All',
    )
Using modality [HE] in section [s2] as spatial/obs reference
Manually specify ['s1'] as source data
[41]:
adata2_p1_spec_predicted
[41]:
AnnData object with n_obs × n_vars = 412152 × 203
    obsm: 'spatial'
[43]:
plot_marker_comparison_superpixel('APOE',
                       adata2_p1_spec_predicted_norm,
                       adata_panel1_norm,
                       'Section2 predicted gene',
                       'Section1 observed Gene',
                        colormap = 'turbo',
                        figscale = 100,)
[ ]:
2-3 Protein prediction
[44]:
adata2_protein_predicted = perform_prediction(data_dict_new,
    final_embeddings,
    target_section = 's2',
    target_modality = 'Protein',
    K_num=500,
    target_molecules='All',
    )
Using modality [HE] in section [s2] as spatial/obs reference
[Protein] exists in ['s3'], which will be used as source data section
[45]:
adata2_protein_predicted
[45]:
AnnData object with n_obs × n_vars = 412152 × 43
    obsm: 'spatial'
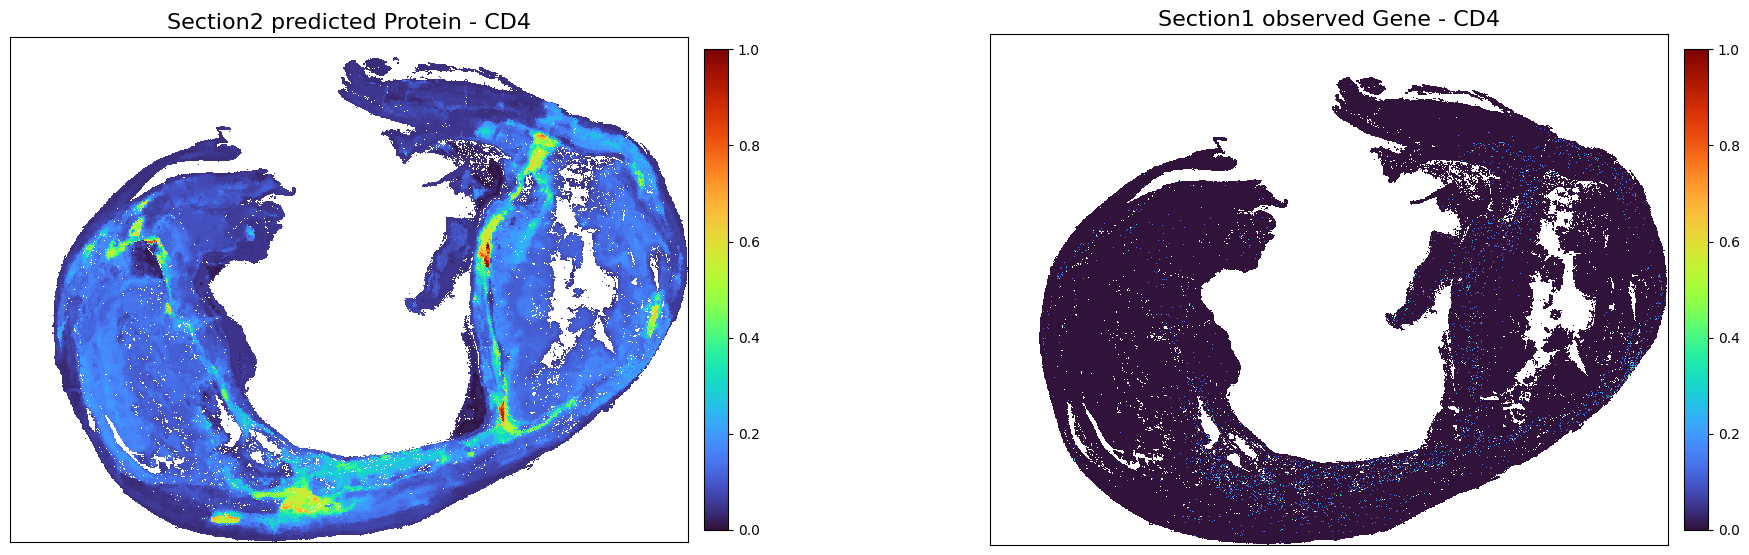
[46]:
adata2_protein_predicted_norm = create_normalized_adata(adata2_protein_predicted)
plot_marker_comparison_superpixel('CD4',
                       adata2_protein_predicted_norm,
                       adata_panel1_norm,
                       'Section2 predicted Protein',
                       'Section1 observed Gene',
                        colormap = 'turbo',
                        figscale = 100,)
[ ]:
Prediction of Section3
3-1 Common genes prediction
[48]:
adata3_com_predicted = perform_prediction(data_dict_new,
    final_embeddings,
    target_section = 's3',
    target_modality = 'RNA_com',
    source_sections=['s1','s2'],
    K_num=500,
    target_molecules='All',
    )
Using modality [HE] in section [s3] as spatial/obs reference
Manually specify ['s1', 's2'] as source data
[49]:
adata3_com_predicted
[49]:
AnnData object with n_obs × n_vars = 430530 × 111
    obsm: 'spatial'
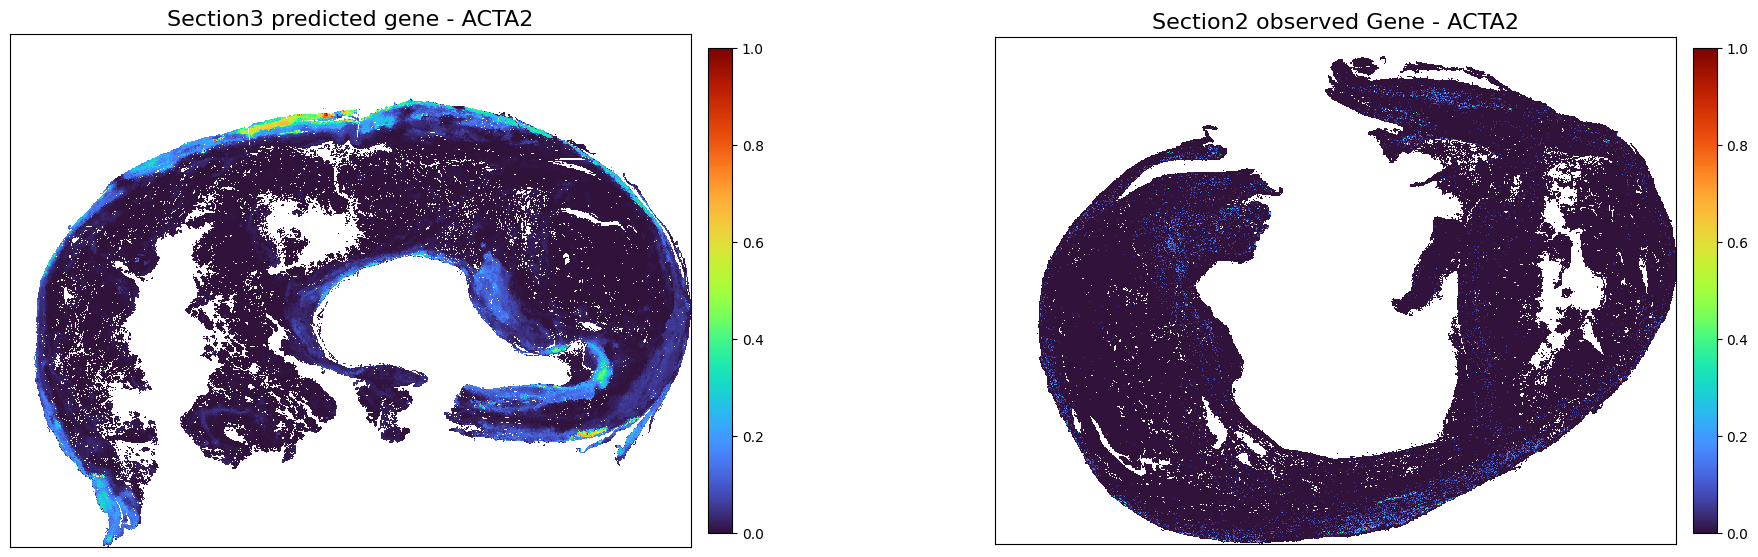
[50]:
adata3_com_predicted_norm = create_normalized_adata(adata3_com_predicted)
plot_marker_comparison_superpixel('ACTA2',
                       adata3_com_predicted_norm,
                       adata_panel2_norm,
                       'Section3 predicted gene',
                       'Section2 observed Gene',
                        colormap = 'turbo',
                        figscale = 100,)
[ ]:
3-2 Panel1-specific genes prediction
[52]:
adata3_p1_spec_predicted = perform_prediction(data_dict_new,
    final_embeddings,
    target_section = 's3',
    target_modality = 'RNA_p1_spec',
    source_sections=['s1'],
    K_num=500,
    target_molecules='All',
    )
Using modality [HE] in section [s3] as spatial/obs reference
Manually specify ['s1'] as source data
[53]:
adata3_p1_spec_predicted
[53]:
AnnData object with n_obs × n_vars = 430530 × 203
    obsm: 'spatial'
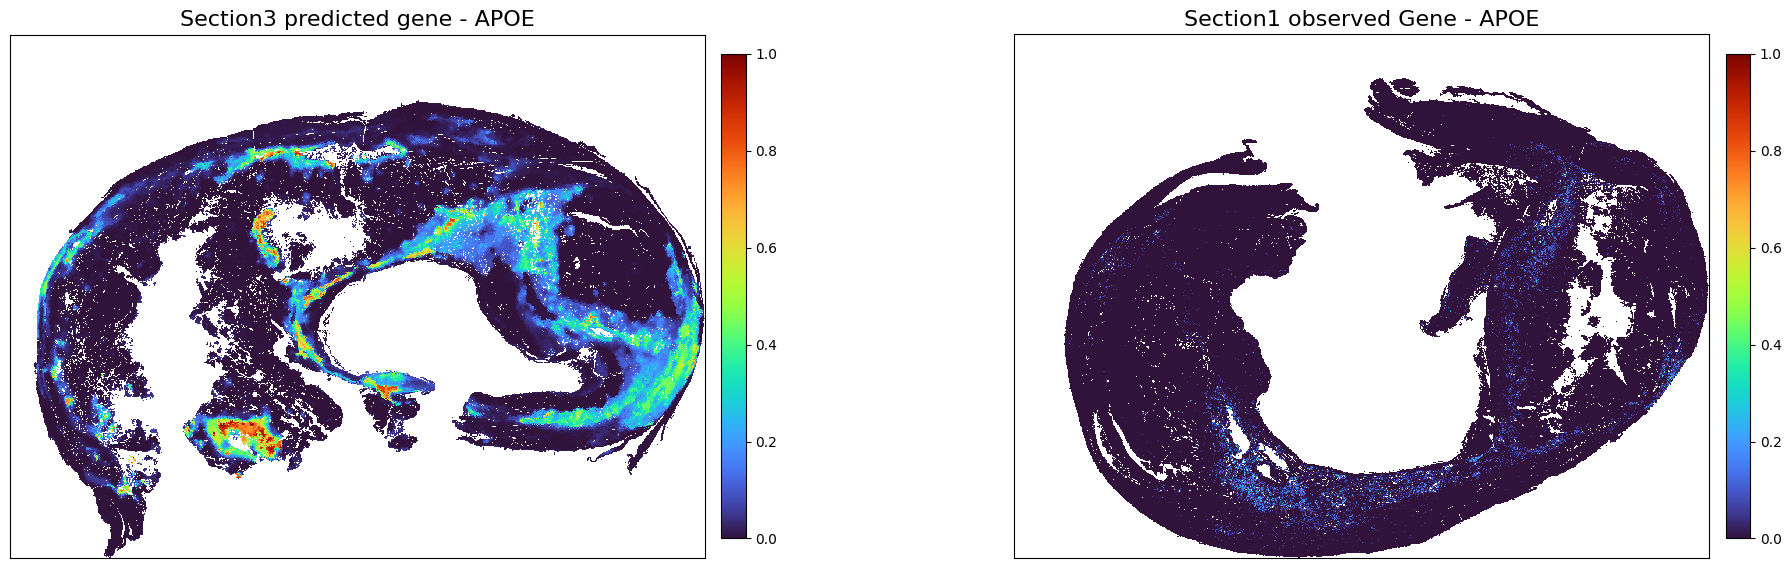
[54]:
adata3_p1_spec_predicted_norm = create_normalized_adata(adata3_p1_spec_predicted)
plot_marker_comparison_superpixel('APOE',
                       adata3_p1_spec_predicted_norm,
                       adata_panel1_norm,
                       'Section3 predicted gene',
                       'Section1 observed Gene',
                        colormap = 'turbo',
                        figscale = 100,)
[ ]:
3-3 Panel2-specific genes prediction
[56]:
adata3_p2_spec_predicted = perform_prediction(data_dict_new,
    final_embeddings,
    target_section = 's3',
    target_modality = 'RNA_p2_spec',
    source_sections=['s2'],
    K_num=500,
    target_molecules='All',
    )
Using modality [HE] in section [s3] as spatial/obs reference
Manually specify ['s2'] as source data
[57]:
adata3_p2_spec_predicted
[57]:
AnnData object with n_obs × n_vars = 430530 × 234
    obsm: 'spatial'
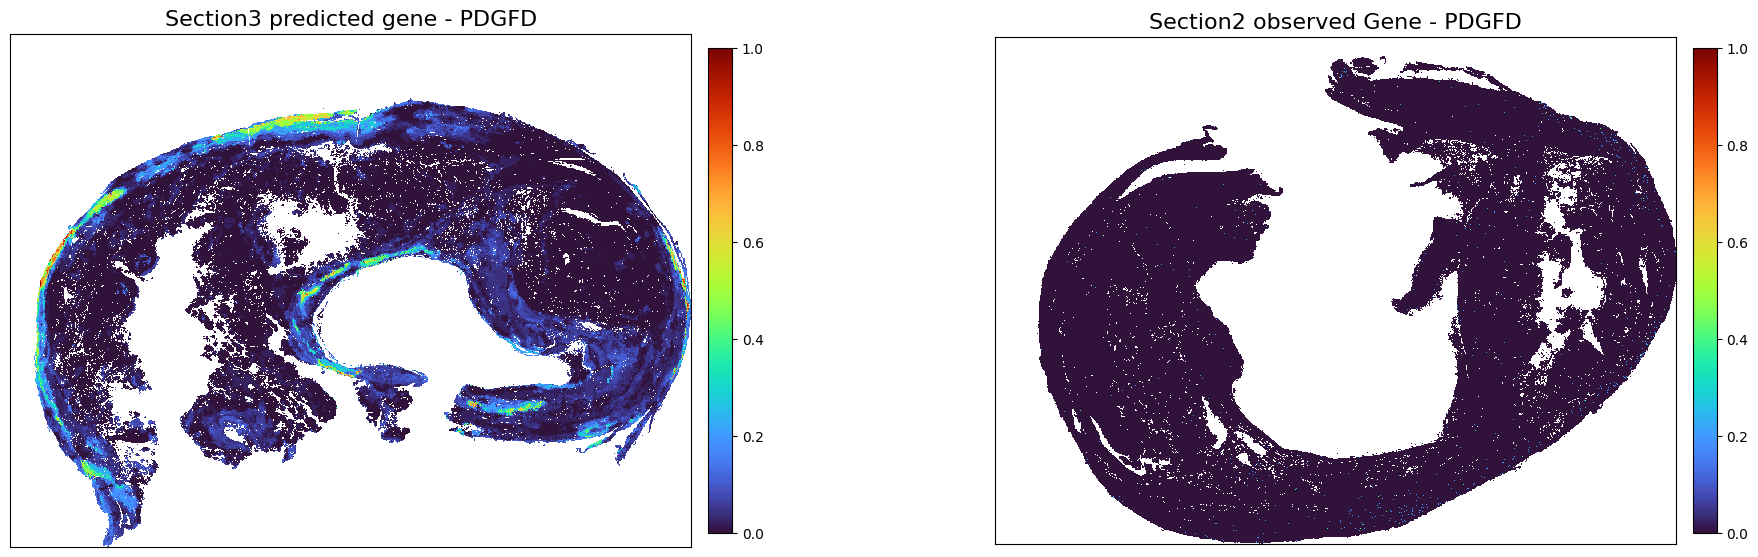
[58]:
adata3_p2_spec_predicted_norm = create_normalized_adata(adata3_p2_spec_predicted)
plot_marker_comparison_superpixel('PDGFD',
                       adata3_p2_spec_predicted_norm,
                       adata_panel2_norm,
                       'Section3 predicted gene',
                       'Section2 observed Gene',
                        colormap = 'turbo',
                        figscale = 100,)
[ ]: